はじめに
Silverlight Toolkit ではチャートを表示するためのコントロールが提供されています。早速、実際にサンプルを作ってチャートを試してみました。
Silverlight Toolkit は下記 URL からダウンロード可能です。
下準備
プロジェクトを用意します
- Silverlight アプリケーションのプロジェクトを新規作成
- 次のアセンブリを参照に追加
- Microsoft.Windows.Controls
- Microsoft.Windows.Controls.DataVisualization
データクラスを用意
public class Product
{
    public string Name { get;set; }
    public decimal Sales { get;set; }
}
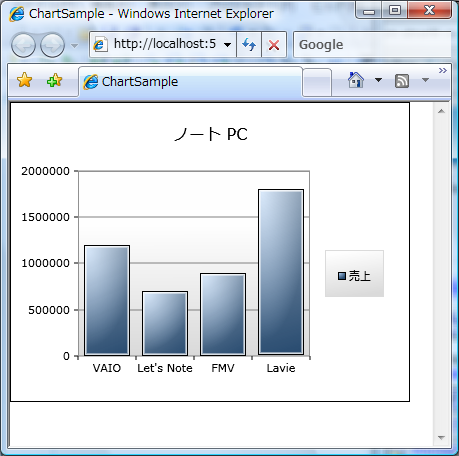
カラムチャートを表示してみます
XAML を記述します
<UserControl x:Class="ChartSample.Page"
    xmlns="http://schemas.microsoft.com/winfx/2006/xaml/presentation"
    xmlns:x="http://schemas.microsoft.com/winfx/2006/xaml"
    xmlns:Controls="clr-namespace:Microsoft.Windows.Controls;assembly=Microsoft.Windows.Controls"
    xmlns:Charting="clr-namespace:Microsoft.Windows.Controls.DataVisualization.Charting;assembly=Microsoft.Windows.Controls.DataVisualization"
    Width="400" Height="300">
    <Grid x:Name="LayoutRoot" Background="White">
        <Charting:Chart Title="ノート PC" x:Name="_chart">
            <Charting:Chart.Series>

                <!--カラムチャートを指定-->
                <Charting:ColumnSeries
                    Title="売上"
                    ItemsSource="{Binding}"
                    IndependentValueBinding="{Binding Name}"
                    DependentValueBinding="{Binding Sales}"/>

            </Charting:Chart.Series>
        </Charting:Chart>
    </Grid>
</UserControl>
チャートにデータをセットします
public partial class Page : UserControl
{
    public Page()
    {
        InitializeComponent();

        _chart.DataContext = new Product[]
        {
            new Product{Name="VAIO",Sales=1200000},
            new Product{Name="Let's Note",Sales=700000},
            new Product{Name="FMV",Sales=900000},
            new Product{Name="Lavie",Sales=1800000},
        };
    }
}
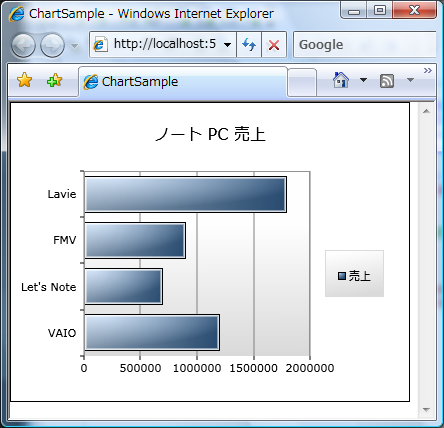
次は棒チャートを表示してみます
先程の XAML を修正します
<UserControl x:Class="ChartSample.Page"
    xmlns="http://schemas.microsoft.com/winfx/2006/xaml/presentation"
    xmlns:x="http://schemas.microsoft.com/winfx/2006/xaml"
    xmlns:Controls="clr-namespace:Microsoft.Windows.Controls;assembly=Microsoft.Windows.Controls"
    xmlns:Charting="clr-namespace:Microsoft.Windows.Controls.DataVisualization.Charting;assembly=Microsoft.Windows.Controls.DataVisualization"
    Width="400" Height="300">
    <Grid x:Name="LayoutRoot" Background="White">
        <Charting:Chart Title="ノート PC" x:Name="_chart">
            <Charting:Chart.Series>

                <!--BarSeries に変更。属性はそのまま。-->
                <Charting:BarSeries
                    Title="売上"
                    ItemsSource="{Binding}"
                    IndependentValueBinding="{Binding Name}"
                    DependentValueBinding="{Binding Sales}"/>

            </Charting:Chart.Series>
        </Charting:Chart>
    </Grid>
</UserControl>
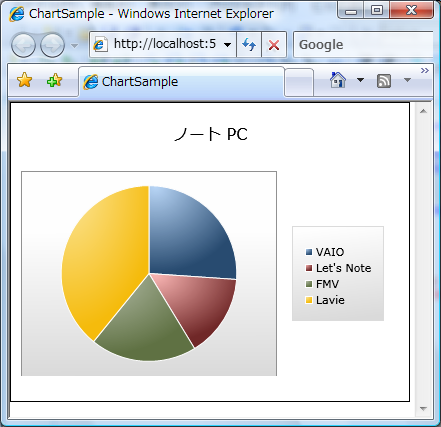
次はパイチャートを表示してみます
先程の XAML を編集します
<UserControl x:Class="ChartSample.Page"
    xmlns="http://schemas.microsoft.com/winfx/2006/xaml/presentation"
    xmlns:x="http://schemas.microsoft.com/winfx/2006/xaml"
    xmlns:Controls="clr-namespace:Microsoft.Windows.Controls;assembly=Microsoft.Windows.Controls"
    xmlns:Charting="clr-namespace:Microsoft.Windows.Controls.DataVisualization.Charting;assembly=Microsoft.Windows.Controls.DataVisualization"
    Width="400" Height="300">
    <Grid x:Name="LayoutRoot" Background="White">
        <Charting:Chart Title="ノート PC" x:Name="_chart">
            <Charting:Chart.Series>

                <!--PieSeries に変更。属性はそのまま。-->
                <Charting:PieSeries
                    Title="売上"
                    ItemsSource="{Binding}"
                    IndependentValueBinding="{Binding Name}"
                    DependentValueBinding="{Binding Sales}"/>

            </Charting:Chart.Series>
        </Charting:Chart>
    </Grid>
</UserControl>
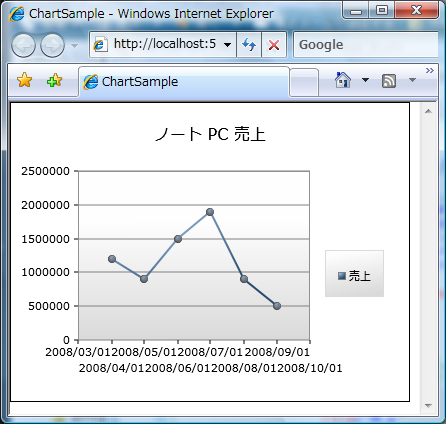
最後に折れ線チャートを表示してみます
データを格納するクラスを修正
public class Product
{
    public string Name { get;set; }
    public decimal Sales { get;set; }
    public DateTime Date { get;set; } // 日付を追加
}
XAML を修正します
<UserControl x:Class="ChartSample.Page"
    xmlns="http://schemas.microsoft.com/winfx/2006/xaml/presentation"
    xmlns:x="http://schemas.microsoft.com/winfx/2006/xaml"
    xmlns:Controls="clr-namespace:Microsoft.Windows.Controls;assembly=Microsoft.Windows.Controls"
    xmlns:Charting="clr-namespace:Microsoft.Windows.Controls.DataVisualization.Charting;assembly=Microsoft.Windows.Controls.DataVisualization"
    Width="400" Height="300">
    <Grid x:Name="LayoutRoot" Background="White">
        <Charting:Chart Title="ノート PC" x:Name="_chart">
            <Charting:Chart.Series>

                <!--LineSeries に変更。-->
                <!--バインドするプロパティも変更しています。-->
                <Charting:LineSeries
                    Title="売上"
                    ItemsSource="{Binding}"
                    IndependentValueBinding="{Binding Date}"
                    DependentValueBinding="{Binding Sales}"/>

            </Charting:Chart.Series>
        </Charting:Chart>
    </Grid>
</UserControl>
チャートにデータをバインドする箇所を修正します
public partial class Page : UserControl
{
    public Page()
    {
        InitializeComponent();

        _chart.DataContext = new Product[]
        {
            new Product{Name="VAIO",Date=new DateTime(2008,4,1),Sales=1200000},
            new Product{Name="VAIO",Date=new DateTime(2008,5,1),Sales=900000},
            new Product{Name="VAIO",Date=new DateTime(2008,6,1),Sales=1500000},
            new Product{Name="VAIO",Date=new DateTime(2008,7,1),Sales=1900000},
            new Product{Name="VAIO",Date=new DateTime(2008,8,1),Sales=900000},
            new Product{Name="VAIO",Date=new DateTime(2008,9,1),Sales=500000},
        };
    }
}
まとめ
Silverlight Toolkit を使えば簡単にチャートが作成できます。カラムチャート・棒チャート・折れ線チャート・パイチャート等が提供されていて、どれも使い方はほとんど同じです。
こんなに簡単にチャートが表示できるなんて!!


